Contact us!

[Page created in 2024 for translation of original content]
The appearance of visible reinforcements on reinforced concrete structures is a sign of weakening of the structure; therefore, monitoring these reinforcements is a major maintenance concern.
They typically occur when water infiltrates the concrete and the metal rods reinforcing the structure rust. These rods expand due to oxidation and rupture the concrete layer on the surface. The development of visible reinforcements makes the structure less and less resistant and can even lead to its collapse.
 Iron Reinforcement Formation Diagram
To enable maintenance managers to detect these defects, Altametris has implemented a service to assist in inspecting these large and often high-up surfaces using drones.
More importantly, Altametris has implemented an automatic detection service for visible reinforcements through the processing and utilization of data collected by drones.
In this context, I joined Altametris' Technical Department for a four-month internship aimed at improving the performance of a visible reinforcement detection model on reinforced concrete structures and optimizing data processing.
1. Object Detection Algorithm
Let's start with a first definition: object detection is a computer vision method that predicts the presence of instances of various classes of objects, such as people or vehicles, in digital images. Here, for example, are the results of detecting people, animals, and everyday objects:
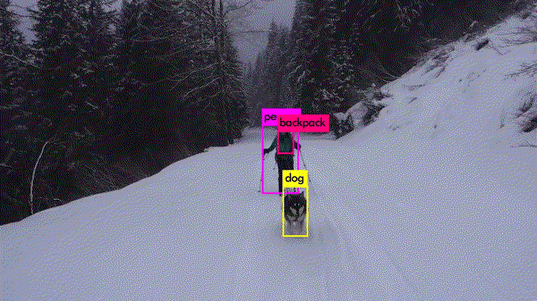 Source : YOLO v3 demonstration Vidéo
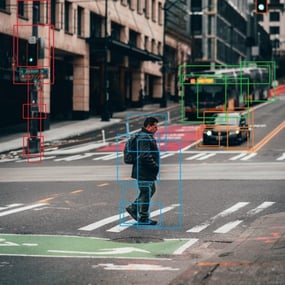
From an image, the algorithm predicts the position of bounding boxes enclosing the objects present.
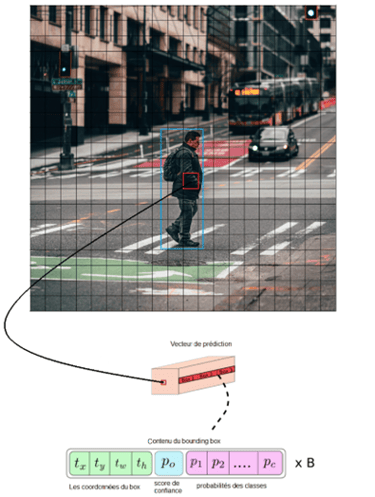
However, the network is not used alone, and many pre-processing and post-processing steps are applied before and after the network's output. Let's start with the internal functioning of the complete algorithm. An image is given as input to the algorithm and is then divided into a grid whose dimensions (S x S) are defined by the user. During inference, the network determines the probability that a cell contains a certain class. The highest probability is assigned to the cell, which can be illustrated as follows:
.webp?width=620&height=244&name=Person.%20Bus.%20Car.%20Traffic%20light%20(signal).webp)
Author : Victor Bercy
From the prediction of class probabilities, a total of B bounding boxes are determined for each cell (S x S).
Author : Victor Bercy
At this stage, for each cell, the algorithm has predicted the position of the center of B×S×S bounding boxes, their length and width, a confidence score regarding the presence of an object near the cell, and a probability per class. This corresponds to a prediction vector with dimensions (S,S,(4+1+C)×B), where C is the number of classes, as illustrated below for a cell associated with the "Person" class.
Author : Victor Bercy
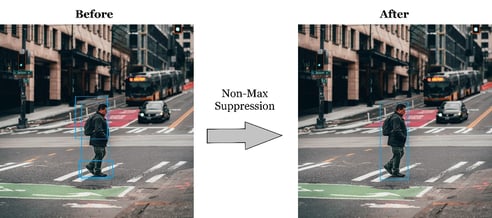
To keep only one box per object, the Non-max suppression (NMS) method is applied. It is based on the "Intersection over Union" (IoU) metric, defined as the ratio of the intersection to the union of the areas of the bounding boxes.
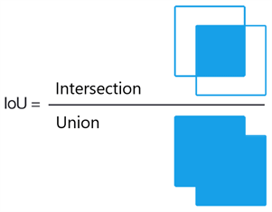
Source : Illustration's Adrian Rosebrock
All boxes are compared to the one with the highest class probability. Boxes overlapping too much with the highest probability box, hence having a high Intersection over Union (IoU), are removed because this means they encompass the same object. Then, the algorithm moves to the box with the second-highest class probability, and so on, to obtain one box per object.
Author : Victor Bercy
At the output of the algorithm, we have a list of the objects detected in the photo. In addition to this detection, there is also the definition of a cost function. It takes into account the predicted class, position, and size of all bounding boxes. It allows the network, especially during training, to quantify the error in predicting the bounding boxes relative to the actual object location and correct it.
2.Optimizing the Performance of the Visible Reinforcement Detection Model
a. Technical context
As seen previously, the network used by Altametris is capable of detecting any type of object provided it has been trained to do so. Therefore, Altametris wanted to leverage the performance of this algorithm to detect visible reinforcements on the surfaces of structures.
To use this type of algorithm, which involves Deep Learning, a first stage of learning, called training, is necessary.
The network needs to learn to recognize the common characteristics of the objects to be detected. For visible reinforcements, these could include their rust color, elongated shape, or the context around them, which typically involves concrete fragments.
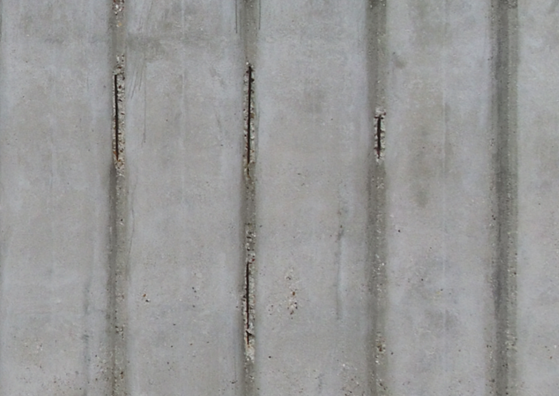
Photograph of four visible reinforcements
Once the object features are selected or the model is trained, it becomes possible to detect them in images that the network has never seen during training. This is referred to as inference or prediction.
For both training and inference, we utilize the Azure Machine Learning cloud computing environment. It provides a graphical interface for model training and comparison, storing data in the cloud, implementing versioning for AI models and datasets, all while utilizing distributed computing power. It is linked to an Azure DevOps environment where pipelines, which are tunnels facilitating the testing and automatic execution of code projects, are set up to train and deploy models into production.
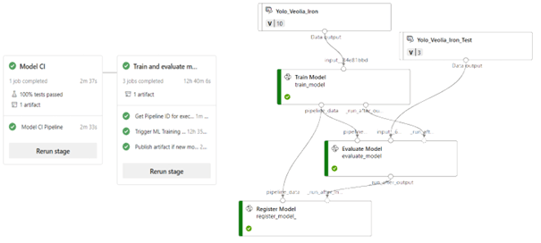
Example of graphical interfaces for Azure DevOps pipelines (left) and trainings on Azure Machine Learning (right)
b. Training a new model
To train a model, it is crucial to first obtain a database. In our case, we need images containing visible reinforcements.
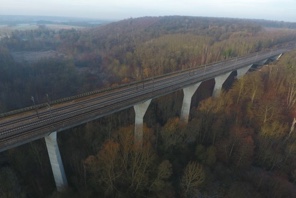
It was within the scope of a client project that the visible reinforcement database was developed: various reinforced concrete structures were photographed using a drone through this service. Once the photographs were processed, we had several orthophotos available containing the entire structures in one piece.
However, this high-resolution format is too voluminous for the network, and the reinforcements present cover only a very small area relative to the surface of the structures. Therefore, tiles are extracted from them to form the database (see illustration below).
 Author : Victor Bercy
To create this database, it is not only necessary to segment tiles from various orthophotos but also to select the relevant tiles to optimize the algorithm's detection performance on new images.
For a neural network, this is referred to as generalization capability. This was a fundamental first step in the work on the automatic detection of visible reinforcements.
We aimed to find the ideal configuration for both the network and the database. Given the ability to load different network configurations, each with its own advantages and disadvantages, we tested them through various training sessions. Similarly, we assessed the relevance of different datasets for training, extracted from the entire set of tiles. To ensure a reliable and meaningful comparison, we decided to create a second dataset, independent and fixed, for evaluation.
To compare, we also need indicators known as "metrics" in Data Science, which allow us to evaluate the accuracy of the prediction of the bounding boxes around visible reinforcements. These are directly calculated by the algorithm (e.g., AP, precision, recall).

Author : Victor Bercy
To determine the performance of a newly trained model, we calculate the value of these metrics on the evaluation data, which the network has never seen before. This allows us to gain a good insight into the behavior and performance of the model on new images.
Then, we compare these scores with the previously saved model and keep the more performant of the two. Thus, the best model is retained and saved in the Cloud along with its scores obtained on the evaluation set.
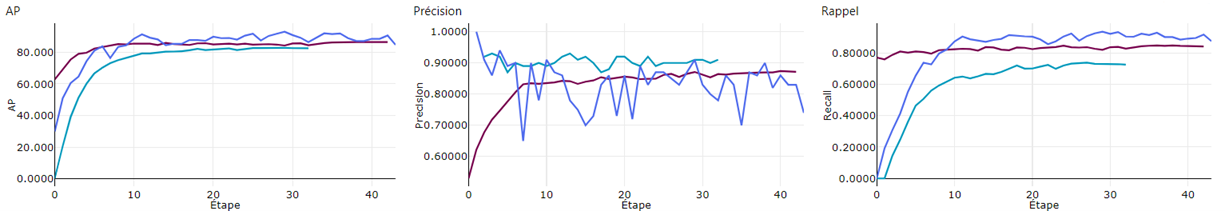
Azure ML Graphs of Metrics Measured for Three YOLO Models Trained for Visible Reinforcement Detection
After numerous versions of both the training and evaluation datasets and trials of different network configurations, we have been able to obtain a much more efficient model for detecting visible reinforcements. In addition to improving its performance, we have also optimized the training process. Several features have been added, such as the inclusion of a consistent evaluation dataset from one training session to another or a new labeling of models on Azure Machine Learning (format and new metrics).
c. Prediction optimization
Once the model for detecting visible reinforcements is trained, it needs to be made usable for prediction: this is the inference step. For example, a client wants to determine whether it is necessary to restore their water tower based on the quantity and size of visible reinforcements on its surface. The client's data, which are new to the network, are then passed to the algorithm to predict the position and size of the reinforcements.
The chosen input data format for the inference chain is the orthophoto. In addition to the previously mentioned advantages, this also provides information on the spatial resolution of the image (in terms of pixels per meter on the structure).
As with the training phase, slicing of the orthophotos is necessary before inference can be performed. Thus, regardless of the spatial resolution of the orthophoto, the size of the visible reinforcements on the tiles remains the same. This normalization step is essential to ensure the network's performance.
However, the slicing performed before inference is specific and inspired by the SAHI (Slicing Aided Hyper Inference) algorithm. This algorithm uses a sliding window approach to predict the position of very small objects on the original image (see illustration below), which is the case for visible reinforcements on orthophotos. This method allows us to achieve better detection performance on small objects, such as visible reinforcements.
Once the inference is completed on all the tiles thus segmented, all that remains is to recombine all the predictions to visualize them on the entire structure.
Thus, as soon as a more efficient model is trained, it is stored in a Docker image along with the entire inference process to be deployed on the Altametris Suite platform. It is now possible to automatically detect visible reinforcements from photos of your structures.
Don't hesitate to ask for a demonstration of the Altametris Suite platform!

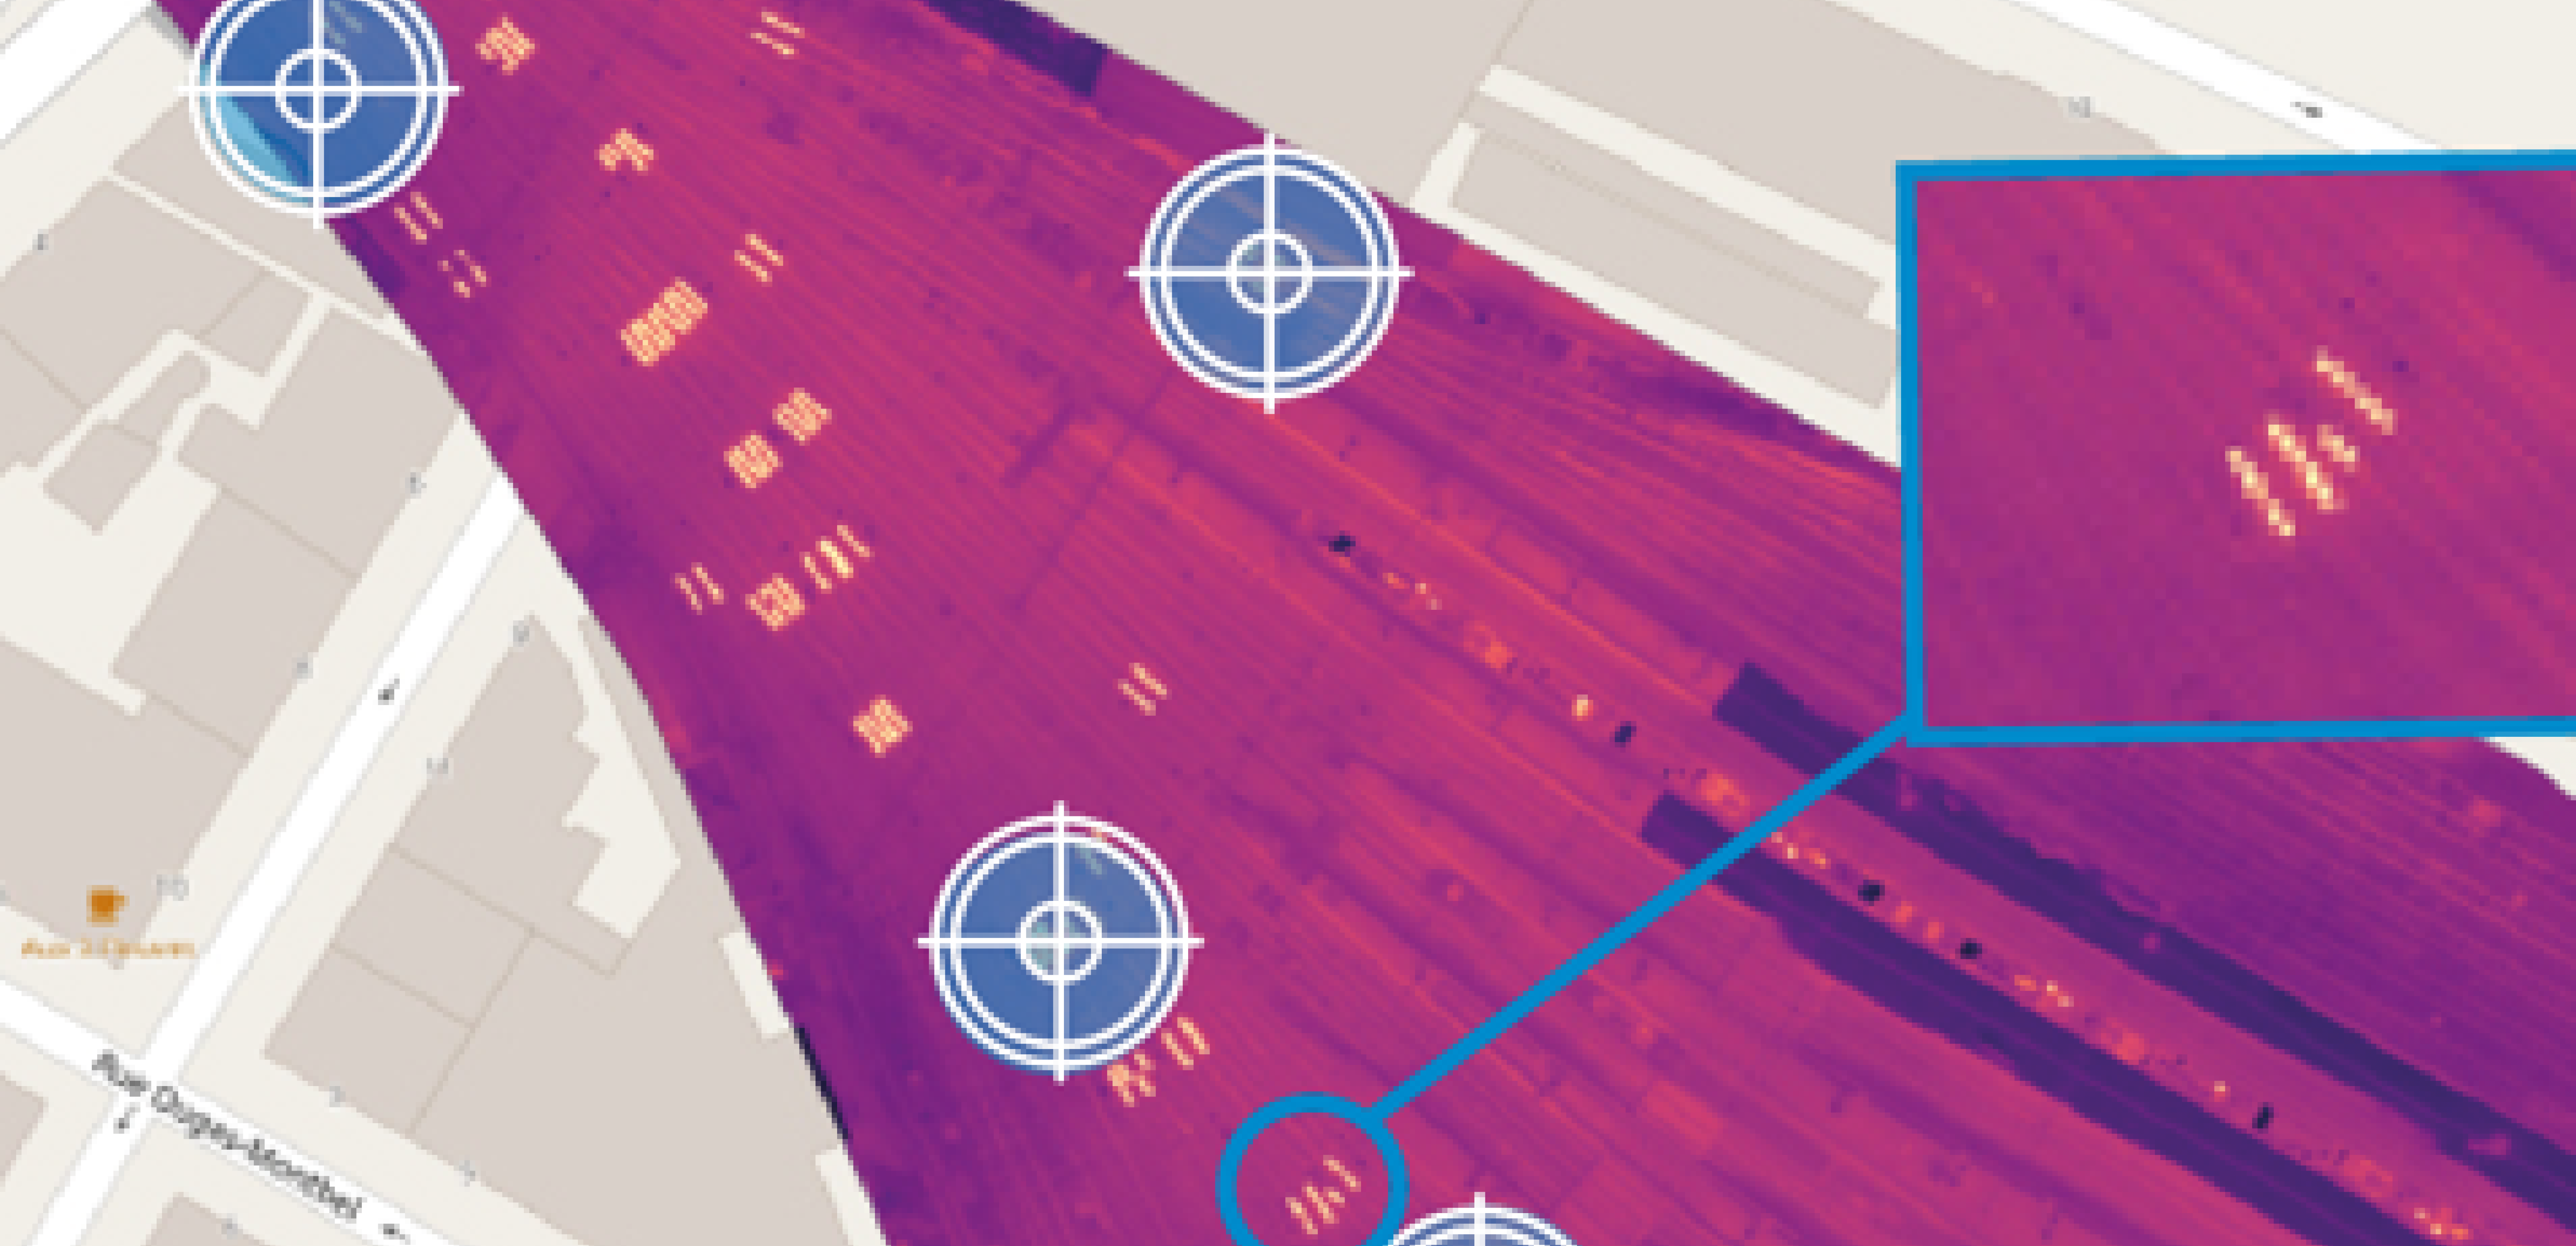
Graphical Interface for Automatic Detection of Visible Reinforcements on Suite
3. A Mission from Start to Finish
- Recruited as an intern to optimize the process of automatic detection of visible reinforcements, from training to inference, I was able to work for three months on the implementation of a service now available to clients. Being able to work on this entire chain and see my work materialize with the deployment of the service on a web platform was a real opportunity and an enriching professional experience.
Weekly meetings with the entire team and check-ins with the Technical Management taught me a lot, both on technical aspects and on the functioning of the company.
I would like to thank the entire Altametris team for their warm and friendly welcome. I especially thank the Technical Management for training and guiding me for four months, the SUITE team for all the shared lunches and their afterworks, and the PROD team for their explosive energy in the open space!